
 Direct marketing is a results-oriented business. Whenever you conduct a campaign, you track and measure results – and then you look for ways to improve on those results.
This ongoing adjustment and testing is what makes direct marketing so powerful.
You don’t have to wonder whether your campaign is working. You can measure campaign performance with actual response numbers.
And you don’t have to wonder if your adjustments helped or hurt your results because it’s right there in black and white.
There are many tactical ways to improve the performance of your direct mail. We spend a lot of time on our website discussing various strategies and tactics – everything from list research to offer strategy to format selection to messaging to copywriting and graphic design.
But this post takes a more analytical view of your campaign by exploring the five key levers of your direct marketing program.
Let’s take a look at the five levers
- CPM or Cost per Thousand Pieces Mailed – basically your mailing costs
- Response Rate – percentage of responses (or leads) from the mailing
- Conversion Rate – percentage of responses that converted into customers
- Gross Profit per Order – how much you will make on each order
- Repeat Gross Profit per Customer – how much you will make over the lifetime of the customer relationship
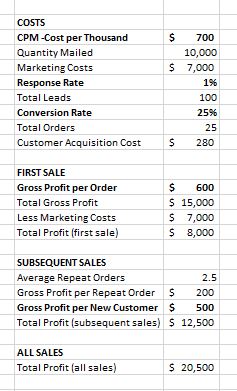
Sample Campaign
As a starting point, let’s look at a sample campaign using some hypothetical numbers – a CPM of $700, a response rate of 1%, a conversion rate of 25%, a gross profit per order of $600 and a gross profit in repeat sales per new customer of $500. Your numbers will vary.
CPM or Cost per Thousand Pieces Mailed
In direct mail, CPM stands for Cost per Thousand pieces mailed. So a mailing that costs 75 cents per piece has a CPM of $750.
Your CPM is made up of four main production costs – the mailing list (rental or purchase), the printing, the addressing/mailing services, and the postage. These are the variable costs of your mailing – meaning they change with quantity.
You also have costs for creative (copy and design). These are fixed costs – meaning they don’t change with quantity. How you factor fixed costs into your calculation is up to you. You could add these costs to your variable costs to create a higher CPM, or just leave them as a separate line item. Keep in mind, the same creative may be used for multiple campaigns so the overall cost impact can be amortized.
In general, direct mail CPM will range from $500 to $1,000 (50 cents to $1 per piece). This number could go higher (even much higher) for complex, multi-component mailers and/or extremely low quantities. CPM seldom goes much below $500.
What can you do to reduce your CPM?
Before you explore options for reducing your CPM, you need to look at what you’re paying now for each of the production services – and then weigh the value (or risk) of trying something different.
It’s important to understand that when you cut costs, you also run the risk of reducing the overall effectiveness of the mailing.
There may be some obvious steps you could take to shave a few cents off of each mailing package, but for significant cuts in CPM, you should probably test first the new lower cost version again your current version.
Let’s look at the four main production services
Mailing list rental – this could range from $50 to $300 per M (a big range, I know) depending on the list you rent. The lower cost lists are demographic-based lists which are more than suitable for many types of mailings. The higher end lists are more behavior-based lists which may be necessary for certain types of mailings. List costs also increase when you get more precise with more “selects” or profile slices.
Printing – this is a big variable depending on the format you’re using and the print quantity. Simple formats like postcards are going to be the least expensive format. Multi-component mailers, which require the separate printing of several direct mail components, will increase your costs significantly. Of all the production costs, printing is most affected by quantity. As you print more, your CPM will decrease.
Addressing and mailing services – as with printing services, your addressing and mailing services will vary depending on the format being used. Postcards have a simple addressing process and require no inserting, while other mailers may involve multiple addressing and multiple inserts. A highly personalized letter package with personal addressing on the envelope, the letter and the reply form can increase your costs considerably. New technologies such as Variable Data Printing (VDP) and personalized landing pages (PURLs) can also add to your costs.
Postage – postage is a large percentage of your mailing costs that is most affected by your postage class (first class vs. standard class) and by how many postage discounts you can earn. Discounts are earned in a variety of ways, but the greatest discounts will come from density mailing if, for example, you are able to mail substantial quantities into specific zip codes or carrier routes.
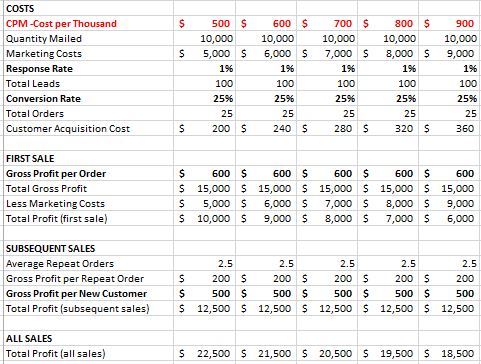
Here is a breakdown of your results based on different CPMs (assuming everything else stays the same):
Response Rate
The response rate is the simplest, most common way to measure the performance of a direct mail campaign.
I am always a little reluctant to give too much weight to the response rate unless the mailing costs and the lead quality are also considered.
But as part of the overall campaign, the response rate is one of the key factors.
Typical response rates for lead generation targeting a cold list are 1-2%. They can go higher or lower. For order generation campaigns (designed to generate a direct order), response rates to a cold list are more often below 1% – sometimes as low as 1/10 of 1% (.001). While this may seem to be an impossibly low response rate, it does work in certain situations.
What can you do to improve your response rate?
The response rate is influenced by many factors – more targeted lists, a different format, added personalization, more relevant messaging, different headlines or teaser copy, improved copy/design, different images, more response channels, etc. This list could go on forever.
But the single most important factor is the offer. The offer should be the centerpiece of your mailer – the whole reason you are mailing, and the whole reason your prospects are responding.
Every offer should be viewed as a value-price equation.
- The value is largely the perceived value of the information you’re offering or the product you’re selling.
- The price is what you pay for the information or product. For information, the price is usually an email address or other contact information. For product, the price, is a dollar amount.
Any change in this value-price equation will change your response rate.
Please note that very often when you change your offer to produce a higher response rate, you will automatically reduce the lead quality which also reduces the conversion rate (see below).
This lead quantity vs. lead quality trade-off is an ongoing challenge in lead generation.
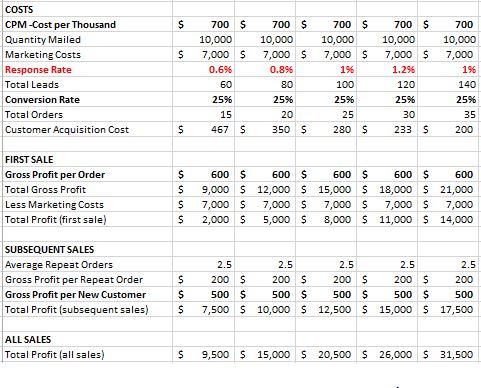
Here is a breakdown of your results based on different response rates (assuming everything else stays the same):
Conversion Rate
The conversion rate tells you what percentage of your leads are converted into orders (or sales). This is a reflection of lead quality and lead follow-up.
If your mailing generates 100 leads and 25 become customers, the conversion rate is 25%. Anything you do to improve the conversion rate will have a major impact on your results.
What can you do to improve your conversion rate?
As discussed above, you can improve your conversion rate with better quality leads. This is accomplished through better, more precise targeting in your mailing lists and/or higher commitment offers.
But higher conversion rates are also accomplished through more aggressive lead follow-up – a consistent email drip sequence, more engaging follow-up content, next-level invitations to webinars, demos or audits, additional direct mail follow-up and scheduled telemarketing calls.
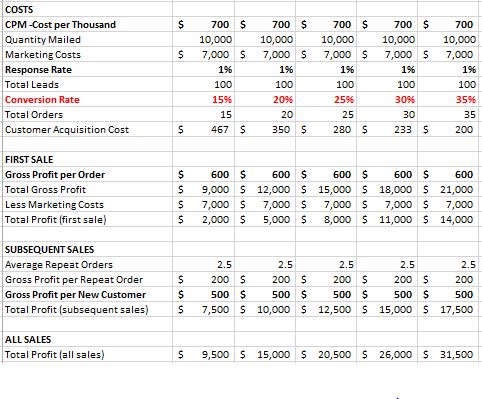
Here is a breakdown of your results based on different conversion rates (assuming everything else stays the same):
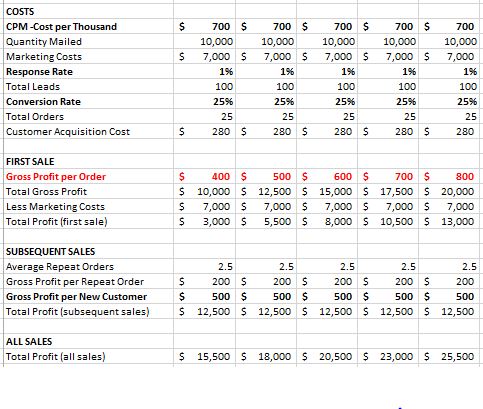
Gross Profit per Order
What do you make on each order? After you remove your manufacturing costs or your costs for providing a service, what’s left over? This is your gross profit per order.
If you are selling a jacket for $100, and your cost to buy that jacket is $30, you have a $70 gross profit per order.
This the number you should use when calculating how many orders you need to break even or make a profit on a single mailing.
How to improve your gross profit per order?
You have a number of options here:
- You can increase your price (but know this might result in fewer orders)
- You can reduce your manufacturing costs (but know this might reduce product quality)
- You can introduce higher priced options (a premium version of your core product)
- You can introduce an up-sell process at the time the order is placed
- You can repackage your product and pricing with low-cost but high-value add-ons
Here is a breakdown of your results based on different gross profits per order (assuming everything else stays the same):
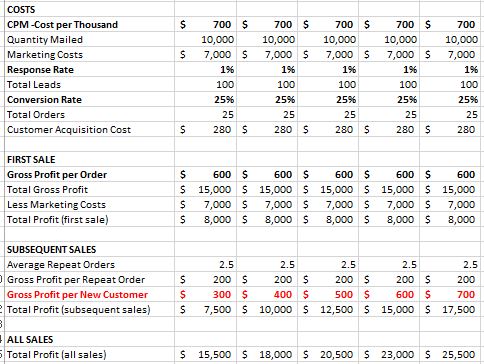
Repeat Gross Profit per Customer
This is often referred to as the Lifetime Value of a Customer. It recognizes that new customers will, on average, buy more products or services from you over a period of time.
Some will never buy again, of course, but others will make many repeat purchases. Over time, you will be able to come up with an average number of repeat sales per customer, and an average profit margin per repeat order.
Taken together, these two factors give you your gross profit per new customer on repeat sales.
When and how often you might see these repeat sales will depend on your business. It could be weeks, months or years. But when you consider the relatively large cost of acquiring a new customer, it can be reassuing to know that each new customer is going to produce (on average) a certain amount of income with just minimal future marketing effort.
How to improve your repeat gross profit per customer
As I outlined above, there are two factors that go into calculating the gross profit per new customer on repeat sales. One is the average number of repeat orders per customer. The other is gross profit per sale.
If you can increase either one of those two numbers, you will improve your overall results.
To increase the number of repeat orders per customer, you might:
- create more selling opportunities with additional products
- develop a more aggressive follow-up campaign
- introduce a customer loyalty program.
To increase the gross profit per order, you might try any of the bullet points listed above under Gross Profit per Order.
Here is a breakdown of your results based on different Repeat Gross Profit per Customer amounts (assuming everything else stays the same):
When these numbers don’t work
For the purposes of this post, I tried to keep it simple and show direct mail results with the changing of one lever only. But in reality, when you change one lever, you often change another at the same time. For example:
- When you reduce your CPM, you could jeopardize your response rate and/or conversion rate.
- When you increase your response rate, you could decrease your conversion rate.
- When you increase your gross profit per order, you might reduce the total number of orders.
No guarantees with any of this, but it’s good to be aware of this potential as you track your results.
- A High-Wire Act for Today’s Marketers - January 28, 2021
- Is it content – or just copy? - May 26, 2020
- How you can – and why you should – use your website to teach - May 12, 2020
- How to Generate Qualified Leads with Lead Surveys - March 1, 2020
- Gaps in your Email Schedule – and how to avoid them - September 4, 2019
- The Dizzying World of Letter Mail - July 22, 2019
- Do you have an Information Kit? - June 25, 2019
- Direct Mail and Those Pesky Millennials - November 8, 2017
- Landing Pages: Do you need a squeeze page or sales page – or both? - May 31, 2017
- Do you have the patience for content and inbound marketing? - May 6, 2017